Calipso
Calipso products can be downloaded by using the download method of the corresponding product object. For this example we will have a look at the cloud layer top and base height at 333 m resolution contained in the 333mCLay product as well as some aerosol variables from 05kmAPro.
[1]:
%load_ext autoreload
%autoreload 2
%matplotlib inline
from datetime import datetime
t_0 = datetime(2016, 11, 21, 10)
t_1 = datetime(2016, 11, 21, 12)
333mCLay
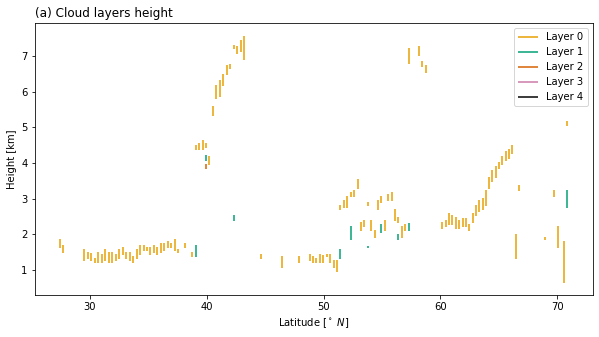
This product contains the top and bottom altitudes of up to five detected cloud layers on the highest resolution: 1/3 km horizontally and 30 m vertically. It is available from about 8.3 km to -0.5 km amsl (see here).
[2]:
from pansat.products.satellite.calipso import clay333m

files_clay = clay333m.download(t_0, t_1)
Please enter your pansat user password:
············
The variable files_clay now contains the downloaded files. Now we only need to decipher the data format and extract the data of interest.
[3]:
dataset = clay333m.open(files_clay[0])
display(dataset)
xarray.Dataset
- layers: 5
- one: 1
- rays: 55920
- rays(rays)int640 1 2 3 ... 55916 55917 55918 55919
array([ 0, 1, 2, ..., 55917, 55918, 55919])
- layers(layers)int640 1 2 3 4
array([0, 1, 2, 3, 4])
- one(one)int640
array([0])
- latitude(rays)float3275.01558 75.01808 ... -64.56511
- unit :
- degree
- description :
- Spacecraft geodetic latitude.
array([ 75.01558, 75.01808, 75.02058, ..., -64.55946, -64.56229, -64.56511], dtype=float32) - longitude(rays)float3213.138031 13.131451 ... -163.55202
- unit :
- degree
- description :
- Spacecraft geodetic longitude.
array([  13.138031,   13.131451,   13.124868, ..., -163.54697 ,
       -163.5495  , -163.55202 ], dtype=float32)
- layer_top_altitude(rays, layers)float321.130534 -9999.0 ... -9999.0
- unit :
- km
array([[ 1.1305341e+00, -9.9990000e+03, -9.9990000e+03, -9.9990000e+03, -9.9990000e+03], [ 1.0706577e+00, -9.9990000e+03, -9.9990000e+03, -9.9990000e+03, -9.9990000e+03], [ 1.0706577e+00, -9.9990000e+03, -9.9990000e+03, -9.9990000e+03, -9.9990000e+03], ..., [ 1.3999774e+00, -9.9990000e+03, -9.9990000e+03, -9.9990000e+03, -9.9990000e+03], [ 1.3700393e+00, -9.9990000e+03, -9.9990000e+03, -9.9990000e+03, -9.9990000e+03], [ 1.3999774e+00, -9.9990000e+03, -9.9990000e+03, -9.9990000e+03, -9.9990000e+03]], dtype=float32) - layer_base_altitude(rays, layers)float320.86109054 -9999.0 ... -9999.0
- unit :
- km
array([[ 8.6109054e-01, -9.9990000e+03, -9.9990000e+03, -9.9990000e+03, -9.9990000e+03], [ 5.0183260e-01, -9.9990000e+03, -9.9990000e+03, -9.9990000e+03, -9.9990000e+03], [ 7.4133790e-01, -9.9990000e+03, -9.9990000e+03, -9.9990000e+03, -9.9990000e+03], ..., [ 1.1604722e+00, -9.9990000e+03, -9.9990000e+03, -9.9990000e+03, -9.9990000e+03], [ 1.0407195e+00, -9.9990000e+03, -9.9990000e+03, -9.9990000e+03, -9.9990000e+03], [ 1.1005958e+00, -9.9990000e+03, -9.9990000e+03, -9.9990000e+03, -9.9990000e+03]], dtype=float32) - num_layers(rays, one)int81 1 1 2 1 1 1 1 ... 1 1 1 1 1 1 1 1
array([[1],
       [1],
       [1],
       ...,
       [1],
       [1],
       [1]], dtype=int8)
[4]:
%matplotlib inline
import matplotlib.pyplot as plt

# Convert -9999 to Nan
tops = dataset.layer_top_altitude.where(dataset.layer_top_altitude != -9999.)
bases = dataset.layer_base_altitude.where(dataset.layer_base_altitude != -9999.)

start = 10000
end = 25000
stride = 100
tops = tops[start:end:stride, :]
bases = bases[start:end:stride, :]
lats = dataset["latitude"][start:end:stride]

plt.figure(figsize=(10, 5))
cols = ["#E69F00", "#009E73", "#D55E00", "#CC79A7", "#000000"]
for i in range(5):
    plt.vlines(lats, bases[:, i], tops[:, i], color=cols[i], label=f"Layer {i}")
plt.xlabel(r"Latitude [$^\circ\ N$]")
plt.ylabel("Height [km]");
plt.legend()
plt.title("(a) Cloud layers height", loc="left")
[4]:
Text(0.0, 1.0, '(a) Cloud layers height')
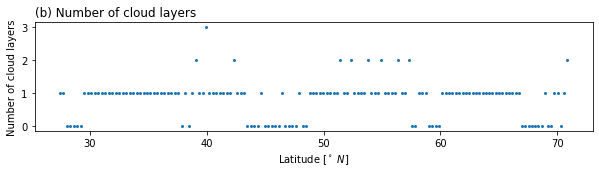
[5]:
%matplotlib inline
import matplotlib.pyplot as plt

start = 10000
end = 25000
stride = 100
num_layers = dataset.num_layers[start:end:stride]
lats = dataset["latitude"][start:end:stride]

plt.figure(figsize=(10, 2))
plt.plot(lats, num_layers, "o", markersize=2)
plt.xlabel(r"Latitude [$^\circ\ N$]")
plt.ylabel("Number of cloud layers");
plt.title("(b) Number of cloud layers", loc="left")
[5]:
Text(0.0, 1.0, '(b) Number of cloud layers')
05kmAPro
This product contains profile information about aerosol layers at 5 km horizontal resolution (vertical resolution is 60 m, although stratospheric features in the altitude range of 20-30 km are reported on 180 m vertically) (see here).
See pansat/products/satellite/calipso/apro5km.ini for all implemented variables from this product.
[6]:
from pansat.products.satellite.calipso import apro5km

files_alay = apro5km.download(t_0, t_1)
dataset = apro5km.open(files_alay[0])
display(dataset)
xarray.Dataset
- bounds: 3
- one: 1
- range_bins: 399
- rays: 3728
- rays(rays)int640 1 2 3 4 ... 3724 3725 3726 3727
array([ 0, 1, 2, ..., 3725, 3726, 3727])
- one(one)int640
array([0])
- range_bins(range_bins)int640 1 2 3 4 5 ... 394 395 396 397 398
array([ 0, 1, 2, ..., 396, 397, 398])
- latitude(rays, bounds)float3275.01558 75.033104 ... -64.56511
- unit :
- degree
- description :
- Spacecraft geodetic latitude.
array([[ 75.01558 , 75.033104, 75.05065 ], [ 75.05316 , 75.0707 , 75.08825 ], [ 75.09075 , 75.10829 , 75.12583 ], ..., [-64.441 , -64.46075 , -64.480484], [-64.48331 , -64.50305 , -64.52279 ], [-64.525604, -64.54534 , -64.56511 ]], dtype=float32) - longitude(rays, bounds)float3213.138031 13.091974 ... -163.55202
- unit :
- degree
- description :
- Spacecraft geodetic longitude.
array([[  13.138031,   13.091974,   13.045916],
       [  13.039327,   12.99312 ,   12.946817],
       [  12.940186,   12.893682,   12.847114],
       ...,
       [-163.44237 , -163.4597  , -163.47705 ],
       [-163.47952 , -163.49695 , -163.51439 ],
       [-163.51689 , -163.53441 , -163.55202 ]], dtype=float32)
- column_optical_depth_tropospheric_aerosols_532(rays, one)float320.0 0.0 ... 0.00983419 0.00983419
- unit :
- 1
array([[0. ], [0. ], [0. ], ..., [0.00983419], [0.00983419], [0.00983419]], dtype=float32) - column_optical_depth_tropospheric_aerosols_uncertainty_532(rays, one)float32-9999.0 -9999.0 ... 0.0050350227
- unit :
- 1
array([[-9.9990000e+03], [-9.9990000e+03], [-9.9990000e+03], ..., [ 5.0350227e-03], [ 5.0350227e-03], [ 5.0350227e-03]], dtype=float32) - column_optical_depth_stratospheric_aerosols_532(rays, one)float320.0 0.0 0.0 0.0 ... 0.0 0.0 0.0 0.0
- unit :
- 1
array([[0.], [0.], [0.], ..., [0.], [0.], [0.]], dtype=float32) - column_optical_depth_stratospheric_aerosols_uncertainty_532(rays, one)float32-9999.0 -9999.0 ... -9999.0 -9999.0
- unit :
- 1
array([[-9999.], [-9999.], [-9999.], ..., [-9999.], [-9999.], [-9999.]], dtype=float32) - column_optical_depth_tropospheric_aerosols_1064(rays, one)float320.0 0.0 ... 0.005808709 0.005808709
- unit :
- 1
array([[0. ], [0. ], [0. ], ..., [0.00580871], [0.00580871], [0.00580871]], dtype=float32) - column_optical_depth_tropospheric_aerosols_uncertainty_1064(rays, one)float32-9999.0 -9999.0 ... 0.009492179
- unit :
- 1
array([[-9.999000e+03], [-9.999000e+03], [-9.999000e+03], ..., [ 9.492179e-03], [ 9.492179e-03], [ 9.492179e-03]], dtype=float32) - column_optical_depth_stratospheric_aerosols_1064(rays, one)float320.0 0.0 0.0 0.0 ... 0.0 0.0 0.0 0.0
- unit :
- 1
array([[0.], [0.], [0.], ..., [0.], [0.], [0.]], dtype=float32) - column_optical_depth_stratospheric_aerosols_uncertainty_1064(rays, one)float32-9999.0 -9999.0 ... -9999.0 -9999.0
- unit :
- 1
array([[-9999.], [-9999.], [-9999.], ..., [-9999.], [-9999.], [-9999.]], dtype=float32) - column_integrated_backscatter_532(rays, one)float320.0543034 ... 0.07334211
- unit :
- sr-1
array([[0.0543034 ], [0.04986113], [0.04901659], ..., [0.07158875], [0.07274868], [0.07334211]], dtype=float32) - total_backscatter_coefficient_532(rays, range_bins)float32-9999.0 -9999.0 ... -9999.0 -9999.0
- unit :
- km-1 sr-1
array([[-9999., -9999., -9999., ..., -9999., -9999., -9999.], [-9999., -9999., -9999., ..., -9999., -9999., -9999.], [-9999., -9999., -9999., ..., -9999., -9999., -9999.], ..., [-9999., -9999., -9999., ..., -9999., -9999., -9999.], [-9999., -9999., -9999., ..., -9999., -9999., -9999.], [-9999., -9999., -9999., ..., -9999., -9999., -9999.]], dtype=float32) - total_backscatter_coefficient_uncertainty_532(rays, range_bins)float32-9999.0 -9999.0 ... -9999.0 -9999.0
- unit :
- km-1 sr-1
array([[-9999., -9999., -9999., ..., -9999., -9999., -9999.], [-9999., -9999., -9999., ..., -9999., -9999., -9999.], [-9999., -9999., -9999., ..., -9999., -9999., -9999.], ..., [-9999., -9999., -9999., ..., -9999., -9999., -9999.], [-9999., -9999., -9999., ..., -9999., -9999., -9999.], [-9999., -9999., -9999., ..., -9999., -9999., -9999.]], dtype=float32) - perpendicular_backscatter_coefficient_532(rays, range_bins)float32-9999.0 -9999.0 ... -9999.0 -9999.0
- unit :
- km-1 sr-1
array([[-9999., -9999., -9999., ..., -9999., -9999., -9999.], [-9999., -9999., -9999., ..., -9999., -9999., -9999.], [-9999., -9999., -9999., ..., -9999., -9999., -9999.], ..., [-9999., -9999., -9999., ..., -9999., -9999., -9999.], [-9999., -9999., -9999., ..., -9999., -9999., -9999.], [-9999., -9999., -9999., ..., -9999., -9999., -9999.]], dtype=float32) - perpendicular_backscatter_coefficient_uncertainty_532(rays, range_bins)float32-9999.0 -9999.0 ... -9999.0 -9999.0
- unit :
- km-1 sr-1
array([[-9999., -9999., -9999., ..., -9999., -9999., -9999.], [-9999., -9999., -9999., ..., -9999., -9999., -9999.], [-9999., -9999., -9999., ..., -9999., -9999., -9999.], ..., [-9999., -9999., -9999., ..., -9999., -9999., -9999.], [-9999., -9999., -9999., ..., -9999., -9999., -9999.], [-9999., -9999., -9999., ..., -9999., -9999., -9999.]], dtype=float32) - particulate_depolarisation_ratio_532(rays, range_bins)float32-9999.0 -9999.0 ... -9999.0 -9999.0
- unit :
- 1
array([[-9999., -9999., -9999., ..., -9999., -9999., -9999.], [-9999., -9999., -9999., ..., -9999., -9999., -9999.], [-9999., -9999., -9999., ..., -9999., -9999., -9999.], ..., [-9999., -9999., -9999., ..., -9999., -9999., -9999.], [-9999., -9999., -9999., ..., -9999., -9999., -9999.], [-9999., -9999., -9999., ..., -9999., -9999., -9999.]], dtype=float32) - particulate_depolarisation_ratio_uncertainty_532(rays, range_bins)float32-9999.0 -9999.0 ... -9999.0 -9999.0
- unit :
- 1
array([[-9999., -9999., -9999., ..., -9999., -9999., -9999.], [-9999., -9999., -9999., ..., -9999., -9999., -9999.], [-9999., -9999., -9999., ..., -9999., -9999., -9999.], ..., [-9999., -9999., -9999., ..., -9999., -9999., -9999.], [-9999., -9999., -9999., ..., -9999., -9999., -9999.], [-9999., -9999., -9999., ..., -9999., -9999., -9999.]], dtype=float32) - backscatter_coefficient_1064(rays, range_bins)float32-9999.0 -9999.0 ... -9999.0 -9999.0
- unit :
- km-1 sr-1
array([[-9999., -9999., -9999., ..., -9999., -9999., -9999.], [-9999., -9999., -9999., ..., -9999., -9999., -9999.], [-9999., -9999., -9999., ..., -9999., -9999., -9999.], ..., [-9999., -9999., -9999., ..., -9999., -9999., -9999.], [-9999., -9999., -9999., ..., -9999., -9999., -9999.], [-9999., -9999., -9999., ..., -9999., -9999., -9999.]], dtype=float32) - backscatter_coefficient_uncertainty_1064(rays, range_bins)float32-9999.0 -9999.0 ... -9999.0 -9999.0
- unit :
- km-1 sr-1
array([[-9999., -9999., -9999., ..., -9999., -9999., -9999.], [-9999., -9999., -9999., ..., -9999., -9999., -9999.], [-9999., -9999., -9999., ..., -9999., -9999., -9999.], ..., [-9999., -9999., -9999., ..., -9999., -9999., -9999.], [-9999., -9999., -9999., ..., -9999., -9999., -9999.], [-9999., -9999., -9999., ..., -9999., -9999., -9999.]], dtype=float32) - aerosol_layer_fraction(rays, range_bins)uint80 0 0 0 0 0 0 0 ... 0 0 0 0 0 0 0 0
- unit :
- /30
array([[0, 0, 0, ..., 0, 0, 0],
       [0, 0, 0, ..., 0, 0, 0],
       [0, 0, 0, ..., 0, 0, 0],
       ...,
       [0, 0, 0, ..., 0, 0, 0],
       [0, 0, 0, ..., 0, 0, 0],
       [0, 0, 0, ..., 0, 0, 0]], dtype=uint8)
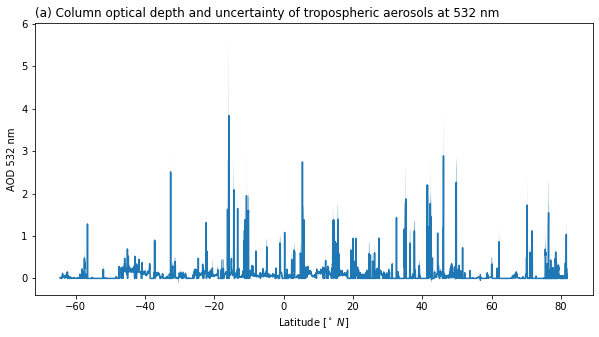
[7]:
%matplotlib inline
import matplotlib.pyplot as plt

lats = dataset.latitude[:,1]
aod = dataset.column_optical_depth_tropospheric_aerosols_532[:, 0]
aod_uncert = dataset.column_optical_depth_tropospheric_aerosols_uncertainty_532[:, 0]
aod_uncert = aod_uncert.where(aod_uncert != -9999.)

plt.figure(figsize=(10, 5))
plt.plot(lats, aod)
plt.fill_between(lats, aod+aod_uncert, aod-aod_uncert)
plt.xlabel(r"Latitude [$^\circ\ N$]")
plt.ylabel("AOD 532 nm")
plt.title("(a) Column optical depth and uncertainty of tropospheric aerosols at 532 nm", loc="left")
[7]:
Text(0.0, 1.0, '(a) Column optical depth and uncertainty of tropospheric aerosols at 532 nm')
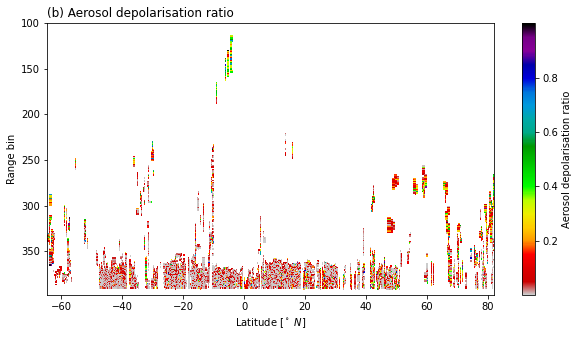
[8]:
%matplotlib inline
import matplotlib.pyplot as plt

depol = dataset.particulate_depolarisation_ratio_532[:,100:]
depol = depol.where(depol > 0.)
depol = depol.where(depol < 1)
lats = dataset.latitude[:,1]
bins = dataset.range_bins[100:]

plt.figure(figsize=(10, 5))
plt.pcolormesh(lats, bins, depol.T, cmap=plt.get_cmap("nipy_spectral_r"))
plt.colorbar(label="Aerosol depolarisation ratio")
plt.gca().invert_yaxis()
plt.xlabel(r"Latitude [$^\circ\ N$]")
plt.ylabel("Range bin")
plt.title("(b) Aerosol depolarisation ratio", loc="left")
[8]:
Text(0.0, 1.0, '(b) Aerosol depolarisation ratio')
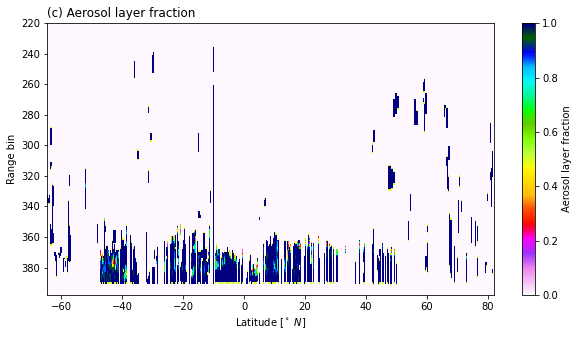
[9]:
%matplotlib inline
import matplotlib.pyplot as plt

# The aerosol profile data is given as 1/30, so need to convert to 1/1.
aerosol = dataset.aerosol_layer_fraction[:,220:]/30.
lats = dataset.latitude[:,1]
bins = dataset.range_bins[220:]

plt.figure(figsize=(10, 5))
plt.pcolormesh(lats, bins, aerosol.T, cmap=plt.get_cmap("gist_ncar_r"))
plt.colorbar(label="Aerosol layer fraction")
plt.gca().invert_yaxis()
plt.xlabel(r"Latitude [$^\circ\ N$]")
plt.ylabel("Range bin")
plt.title("(c) Aerosol layer fraction", loc="left")
[9]:
Text(0.0, 1.0, '(c) Aerosol layer fraction')