IGRA
Download data from the Integrated Global Radiosonde Archive (IGRA): https://www.ncdc.noaa.gov/data-access/weather-balloon/integrated-global-radiosonde-archive
[1]:
from pansat.products.stations import igra
Per station
For the download for a specific station, select the station name or look for the closest station to a location[lat,lon].
[2]:
# create product instance for station location (finds closest station to [lat,lon])
radiosounding = igra.IGRASoundings(location=[35,105])
[5]:
# have a look at the meta data from the station
stations= radiosounding.get_metadata(station=True)
stations
[5]:
| ID | lat | lon | elevation [m] | name | start year | end year | # soundings in record | |
|---|---|---|---|---|---|---|---|---|
| 553 | CHM00057006 | 34.583 | 105.75 | 1143.0 | TIANSHUI | 1973 | 1987 | 6899 |
[11]:
# download all data for station by name
radiosounding = igra.IGRASoundings('ABU DHABI INTERNATIONAL AIRPOR')
file = radiosounding.download()
Per variable (monthly, all stations)
To download data from all stations, choose a variable to download. This data will come as monthly means in two separate files for day and night (00:00 UTC and 12:00 UTC).
[2]:
radiosounding = igra.IGRASoundings(variable = 'temp')
Please enter your pansat user password:
········
[3]:
# download only recent month
files = radiosounding.download('recent')
Open and plot data
[4]:
# get data as pandas dataframe
data00= radiosounding.open(files[0])
data12= radiosounding.open(files[1])

data00
[4]:
| Station | Year | Month | Level [hPa] | Value [$^\circ$C/10, m s$^{-1}$ or Pa] | Num | |
|---|---|---|---|---|---|---|
| 0 | AEM00041217 | 2020 | 12 | 1000 | 212 | 31 |
| 1 | AEM00041217 | 2020 | 12 | 925 | 164 | 31 |
| 2 | AEM00041217 | 2020 | 12 | 850 | 130 | 31 |
| 3 | AEM00041217 | 2020 | 12 | 700 | 54 | 31 |
| 4 | AEM00041217 | 2020 | 12 | 500 | -101 | 31 |
| ... | ... | ... | ... | ... | ... | ... |
| 9236 | VMM00048900 | 2020 | 12 | 70 | -741 | 29 |
| 9237 | VMM00048900 | 2020 | 12 | 50 | -667 | 29 |
| 9238 | VMM00048900 | 2020 | 12 | 30 | -603 | 29 |
| 9239 | VMM00048900 | 2020 | 12 | 20 | -537 | 29 |
| 9240 | VMM00048900 | 2020 | 12 | 10 | -462 | 28 |
9241 rows × 6 columns
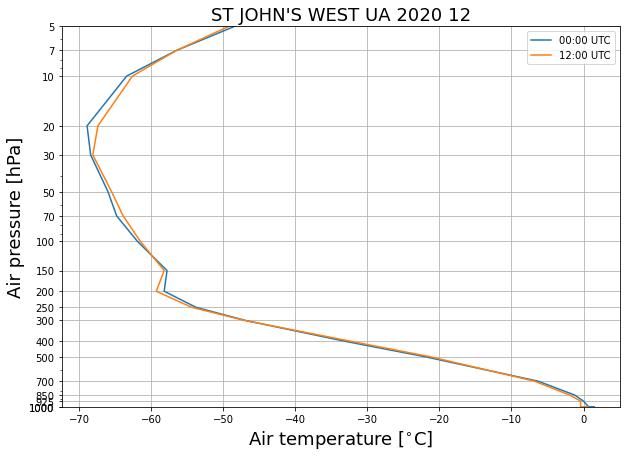
[9]:
# choose a random station
station = data00.Station.values[999]
temp00 = data00[data00.Station == station]
temp12 = data12[data12.Station == station]

# get station name
station_name= radiosounding.locations[radiosounding.locations.ID == station].name.values[0]
[10]:
import matplotlib.pyplot as plt
plt.figure(figsize=(10,7))
# plot temperature at specific station during two times a day
pressure= temp00.iloc[:,3].values
# set surface pressure to 1000 hPa
pressure[pressure == 9999]= 1000

plt.plot(temp00.iloc[:,4].values/10,pressure, label = '00:00 UTC')
plt.plot(temp12.iloc[:,4].values/10,pressure, label ='12:00 UTC')
plt.legend()

plt.gca().invert_yaxis()
plt.yscale('log')
plt.yticks(temp00.iloc[:,3], temp00.iloc[:,3])
plt.ylim(pressure.max(), pressure.min())
plt.grid()

# labels
fs= 18
plt.title(station_name + ' '+ str(temp00.Year.values[0]) + ' '+str(temp00.Month.values[0]),fontsize= fs)
plt.xlabel('Air temperature [$^{\circ}$C]', fontsize= fs)
plt.ylabel('Air pressure [hPa]', fontsize= fs)
plt.show()