Global Precipitation Measurement (GPM)
A range of GPM products are provided by the pansat.products.satellite.gpm module.
[1]:
%load_ext autoreload
%autoreload 2
from datetime import datetime
t_0 = datetime(2016, 11, 21, 10)
t_1 = datetime(2016, 11, 21, 12)
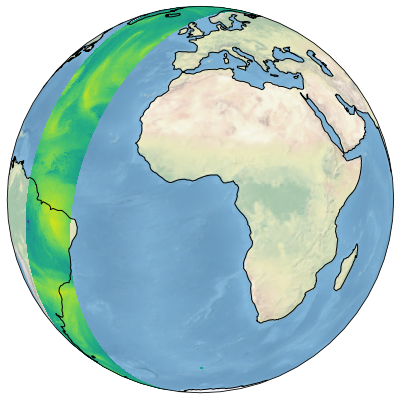
1C GMI remapped
The GMI 1C-R (remapped) product contains the brightness temperatures from the GMI sensor mapped to a common swath. The brightness temperatures of the different channels can be accessed via the tbs_1 and tbs_2 variables, which contain the lower and higher frequency channels, respectively.
[2]:
from pansat.products.satellite.gpm import l1c_gpm_gmi_r
t_0 = datetime(2016, 11, 21, 10)
t_1 = datetime(2016, 11, 21, 12)
files = l1c_gpm_gmi_r.download(t_0, t_1)
Please enter your pansat user password:
········
Example
To exemplify this, the two code cells below generate a plot of the swath of the lowest channel of the GMI sensor. This channels corresponds to the first element of the tbs_1 variable of the data.
[3]:
import numpy as np
from h5py import File
dataset = l1c_gpm_gmi_r.open(files[0])
lats = dataset["latitude"]
lons = dataset["longitude"]
tbs_1 = dataset["tbs_1"]
[4]:
import matplotlib.pyplot as plt
from matplotlib.cm import get_cmap
from matplotlib.colors import Normalize
from matplotlib.gridspec import GridSpec
import cartopy.crs as ccrs

cmap = get_cmap("magma")
cmap.set_bad("grey")
norm = Normalize(100, 300)

gs = GridSpec(1, 2, width_ratios=[1.0, 0.05])
fig = plt.figure(figsize=(8, 8))
proj = ccrs.NearsidePerspective(central_longitude=lons.mean(),
                                central_latitude=lats.mean())
ax = plt.subplot(gs[0], projection=proj)
ax.stock_img()
ax.coastlines()
ax.pcolormesh(lons, lats, tbs_1[:, :, 1], transform=ccrs.PlateCarree(), norm=norm)
<ipython-input-4-e626ab25980d>:8: MatplotlibDeprecationWarning: You are modifying the state of a globally registered colormap. In future versions, you will not be able to modify a registered colormap in-place. To remove this warning, you can make a copy of the colormap first. cmap = copy.copy(mpl.cm.get_cmap("magma"))
  cmap.set_bad("grey")
/home/simonpf/build/anaconda3/envs/pansat/lib/python3.8/site-packages/cartopy/mpl/geoaxes.py:1597: UserWarning: The input coordinates to pcolormesh are interpreted as cell centers, but are not monotonically increasing or decreasing. This may lead to incorrectly calculated cell edges, in which case, please supply explicit cell edges to pcolormesh.
  X, Y, C, shading = self._pcolorargs('pcolormesh', *args,
[4]:
<matplotlib.collections.QuadMesh at 0x7fee03d456a0>
1C Metop-B MHS
The l1c_metopb_mhs is another level 1 product, which provides the calibrated brightness temperatures of the MHS sensor onboard Metop-B.
[5]:
from pansat.products.satellite.gpm import l1c_metopb_mhs
t_0 = datetime(2016, 11, 24, 10)
t_1 = datetime(2016, 11, 24, 12)
files = l1c_metopb_mhs.download(t_0, t_1)
[6]:
dataset = l1c_metopb_mhs.open(str(files[0]))
lats = dataset["latitude"]
lons = dataset["longitude"]
tbs = dataset["tbs"].data
[7]:
import matplotlib.pyplot as plt
from matplotlib.cm import get_cmap
from matplotlib.colors import LogNorm
from matplotlib.gridspec import GridSpec
import cartopy.crs as ccrs

cmap = get_cmap("magma")
cmap.set_bad("grey")
norm = LogNorm(1e-3, 1e2)

gs = GridSpec(1, 2, width_ratios=[1.0, 0.05])
fig = plt.figure(figsize=(8, 8))
proj = ccrs.NearsidePerspective(central_longitude=lons.mean(),
                                central_latitude=lats.mean())
ax = plt.subplot(gs[0], projection=proj)
ax.stock_img()
ax.coastlines()
ax.pcolormesh(lons, lats, tbs[:, :, 2], transform=ccrs.PlateCarree())
<ipython-input-7-4dbe7e5c5228>:8: MatplotlibDeprecationWarning: You are modifying the state of a globally registered colormap. In future versions, you will not be able to modify a registered colormap in-place. To remove this warning, you can make a copy of the colormap first. cmap = copy.copy(mpl.cm.get_cmap("magma"))
  cmap.set_bad("grey")
/home/simonpf/build/anaconda3/envs/pansat/lib/python3.8/site-packages/cartopy/mpl/geoaxes.py:1597: UserWarning: The input coordinates to pcolormesh are interpreted as cell centers, but are not monotonically increasing or decreasing. This may lead to incorrectly calculated cell edges, in which case, please supply explicit cell edges to pcolormesh.
  X, Y, C, shading = self._pcolorargs('pcolormesh', *args,
[7]:
<matplotlib.collections.QuadMesh at 0x7fee0050b6d0>
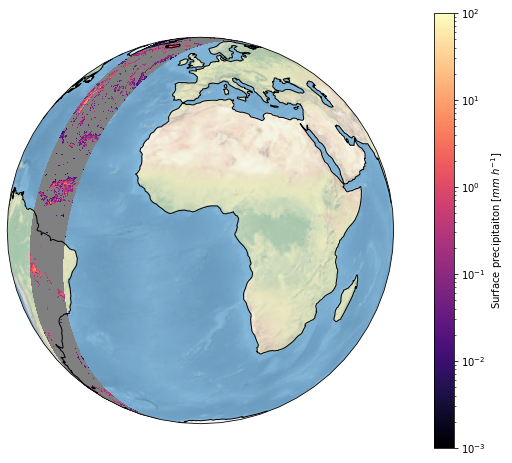
2A GPROF GMI
The level 2 GPROF product contain the precipitation retrieved from the passive sensors of the GPM constellation using the GPROF algorithm. The l2a_gprof_gpm_gmi product provides the precipitation retrieved from the GMI sensor onboard the GPM Core Observatory.
[2]:
from pansat.products.satellite.gpm import l2a_gprof_gpm_gmi
files = l2a_gprof_gpm_gmi.download(t_0, t_1)
[3]:
dataset = l2a_gprof_gpm_gmi.open(str(files[0]))
lats = dataset["latitude"]
lons = dataset["longitude"]
precip = dataset["surface_precipitation"]
The h5py package is required to read HDF5 files. Please install it.
---------------------------------------------------------------------------
ModuleNotFoundError                       Traceback (most recent call last)
<ipython-input-3-f13b0440fdc7> in <module>
----> 1 dataset = l2a_gprof_gpm_gmi.open(str(files[0]))
      2 lats = dataset["latitude"]
      3 lons = dataset["longitude"]
      4 precip = dataset["surface_precipitation"]

~/src/pansat/pansat/products/satellite/gpm/__init__.py in open(self, filename)
    146             filename(``pathlib.Path`` or ``str``): The GPM file to open.
    147         """
--> 148         from pansat.formats.hdf5 import HDF5File
    149
    150         file_handle = HDF5File(filename, "r")

~/src/pansat/pansat/formats/hdf5.py in <module>
     14 except ImportError as error:
     15     print("The h5py package is required to read HDF5 files. Please install it.")
---> 16     raise error
     17
     18

~/src/pansat/pansat/formats/hdf5.py in <module>
     11
     12 try:
---> 13     from h5py import File
     14 except ImportError as error:
     15     print("The h5py package is required to read HDF5 files. Please install it.")

ModuleNotFoundError: No module named 'h5py'
[ ]:
import matplotlib.pyplot as plt
from matplotlib.cm import get_cmap
from matplotlib.colors import LogNorm
from matplotlib.gridspec import GridSpec
import cartopy.crs as ccrs

cmap = get_cmap("magma")
cmap.set_bad("grey")
norm = LogNorm(1e-3, 1e2)

gs = GridSpec(1, 2, width_ratios=[1.0, 0.05])
fig = plt.figure(figsize=(8, 8))
proj = ccrs.NearsidePerspective(central_latitude=lats.mean(),
                                central_longitude=lons.mean())
ax = plt.subplot(gs[0], projection=proj)
ax.stock_img()
ax.coastlines()
sm = ax.pcolormesh(lons, lats, precip, cmap=cmap, norm=norm, transform=ccrs.PlateCarree())

ax = plt.subplot(gs[1])
plt.colorbar(sm, cax=ax, fraction=0.4, pad=0.2, label="Surface precipitaiton [$mm\ h^{-1}$]")
plt.show()
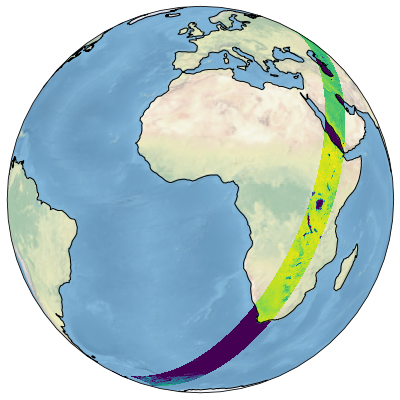
2A GPROF Metop-B MHS
The l2a_gprof_metopb_mhs product provides the precipitation retrieved from the MHS sensor onboard the Metop-B satellite.
[11]:
from pansat.products.satellite.gpm import l2a_gprof_metopb_mhs
files = l2a_gprof_metopb_mhs.download(t_0, t_1)
[12]:
dataset = l2a_gprof_gpm_gmi.open(files[0])
lats = dataset["latitude"]
lons = dataset["longitude"]
precip = dataset["surface_precipitation"]
[13]:
import matplotlib.pyplot as plt
from matplotlib.cm import get_cmap
from matplotlib.colors import LogNorm
from matplotlib.gridspec import GridSpec
import cartopy.crs as ccrs

cmap = get_cmap("magma")
cmap.set_bad("grey")
norm = LogNorm(1e-3, 1e2)

gs = GridSpec(1, 2, width_ratios=[1.0, 0.05])
fig = plt.figure(figsize=(8, 8))
proj = ccrs.NearsidePerspective(central_latitude=lats.mean(),
                                central_longitude=lons.mean())
ax = plt.subplot(gs[0], projection=proj)
ax.stock_img()
ax.coastlines()
sm = ax.pcolormesh(lons, lats, precip, cmap=cmap, norm=norm, transform=ccrs.PlateCarree())

ax = plt.subplot(gs[1])
plt.colorbar(sm, cax=ax, fraction=0.4, pad=0.2, label="Surface precipitaiton [$mm\ h^{-1}$]")
plt.show()
<ipython-input-13-0682ee7a20c4>:8: MatplotlibDeprecationWarning: You are modifying the state of a globally registered colormap. In future versions, you will not be able to modify a registered colormap in-place. To remove this warning, you can make a copy of the colormap first. cmap = copy.copy(mpl.cm.get_cmap("magma"))
  cmap.set_bad("grey")
/home/simonpf/build/anaconda3/envs/pansat/lib/python3.8/site-packages/cartopy/mpl/geoaxes.py:1597: UserWarning: The input coordinates to pcolormesh are interpreted as cell centers, but are not monotonically increasing or decreasing. This may lead to incorrectly calculated cell edges, in which case, please supply explicit cell edges to pcolormesh.
  X, Y, C, shading = self._pcolorargs('pcolormesh', *args,
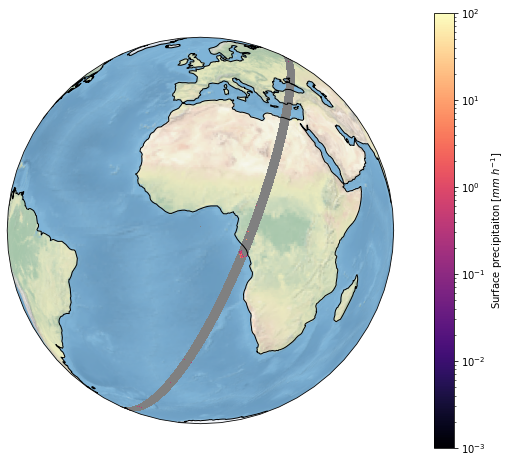
2B combined product
The level 2 combined producte provides surface precipitation values that were retrieved using the radar and passive signals together. Since they depende on the radar the data is provide on a much thinner swath albeit at a higher resolution of around 5 km.
[14]:
from pansat.products.satellite.gpm import l2b_gpm_cmb
files = l2b_gpm_cmb.download(t_0, t_1)
[15]:
dataset = l2b_gpm_cmb.open(files[0])
lats = dataset["latitude"]
lons = dataset["longitude"]
precip = dataset["surface_precipitation"]
[16]:
files[0]
[16]:
PosixPath('GPM/2B.GPM.DPRGMI.2HCSHv4-1.20161124-S113145-E130417.015571.V06A.HDF5')
[17]:
import matplotlib.pyplot as plt
from matplotlib.cm import get_cmap
from matplotlib.colors import LogNorm
from matplotlib.gridspec import GridSpec
import cartopy.crs as ccrs

cmap = get_cmap("magma")
cmap.set_bad("grey")
norm = LogNorm(1e-3, 1e2)

gs = GridSpec(1, 2, width_ratios=[1.0, 0.05])
fig = plt.figure(figsize=(8, 8))
proj = ccrs.NearsidePerspective(central_latitude=lats.mean(),
                                central_longitude=lons.mean())
ax = plt.subplot(gs[0], projection=proj)
ax.stock_img()
ax.coastlines()
sm = ax.pcolormesh(lons, lats, precip, cmap=cmap, norm=norm, transform=ccrs.PlateCarree())

ax = plt.subplot(gs[1])
plt.colorbar(sm, cax=ax, fraction=0.4, pad=0.2, label="Surface precipitaiton [$mm\ h^{-1}$]")
plt.show()
<ipython-input-17-0682ee7a20c4>:8: MatplotlibDeprecationWarning: You are modifying the state of a globally registered colormap. In future versions, you will not be able to modify a registered colormap in-place. To remove this warning, you can make a copy of the colormap first. cmap = copy.copy(mpl.cm.get_cmap("magma"))
  cmap.set_bad("grey")
/home/simonpf/build/anaconda3/envs/pansat/lib/python3.8/site-packages/cartopy/mpl/geoaxes.py:1597: UserWarning: The input coordinates to pcolormesh are interpreted as cell centers, but are not monotonically increasing or decreasing. This may lead to incorrectly calculated cell edges, in which case, please supply explicit cell edges to pcolormesh.
  X, Y, C, shading = self._pcolorargs('pcolormesh', *args,